
Fermi problem: a tasty approach
A Fermi problem is a question that intentionally has no exact answer but instead involves a series of estimates to get a rough idea of a solution. Finding innovative ways to celebrate milestones and generate valuable insights is crucial for BrightMinded, and so is recognising and celebrating our team to boost morale and promote our brand values.
In this article, we explore creative estimation techniques that can bring some fun to the workplace while recognising the people you work with.

Index
- Introduction
- What did we do?
- Breaking down the calculation
- Other examples of Fermi problems
- How these questions stimulate thinking
- Conclusion
TL;DR summary
- Fermi problems are estimation exercises that provide approximate answers to questions using available data and logical assumptions.
- BrightMinded applied a Fermi problem to estimate how many pizzas the team has eaten during work lunches, using factors like tenure, office attendance, and pizza-ordering habits.
- Rules were applied to account for team members’ varying presence, pizza preferences, and frequency of team lunches to calculate individual and total pizza consumption.
- Fermi problems can be adapted to many fun or professional questions, like airport traffic, Santa’s Christmas deliveries, or filling a suitcase with golf balls.
- These exercises encourage critical thinking, teamwork, and engagement, while also providing a playful way to explore data and stimulate discussion.
Introduction
Exploring new methods to highlight milestones and celebrate the ways that you are proud of your team can foster long-term relationships. It also shows your current and future clients where your values lie and demonstrates your genuine commitment to the people you work with.
At BrightMinded, we continually seek innovative ways to show our team’s unique strengths and achievements. It is always interesting to uncover statistics like these, as they allow us to highlight our growth as a company.
After all, recognizing the people you work with is crucial. While brainstorming creative ways to present this data, we realised that the numbers representing us don’t always have to be strictly business-related, they can be fun and lighthearted too!
This is why we decided to use a statistic that everyone can relate to: How much pizza do you and your team eat?
Whether you indulge in pizza once a month or consider yourself a pizza loving enthusiast, it is a question we are all able to answer!
What did we do?
For this experiment, we chose to explore the question: How many pizzas have our team members eaten during team lunches?
This question adds depth to our calculations by focusing on shared experiences rather than simply calculating how much each person has eaten over their lifetime. It allows us to connect closer to our team as opposed to just individuals, as we can demonstrate the length of time someone has been at BrightMinded.
The question also introduces a more complex and engaging challenge. It requires us to consider additional factors and put in more effort than a straightforward calculation would, making the process more enjoyable and thought-provoking as we work toward the answer.
To gather the information needed for this calculation, we asked the BrightMinded family the following questions:
- How long have you been working for BrightMinded?
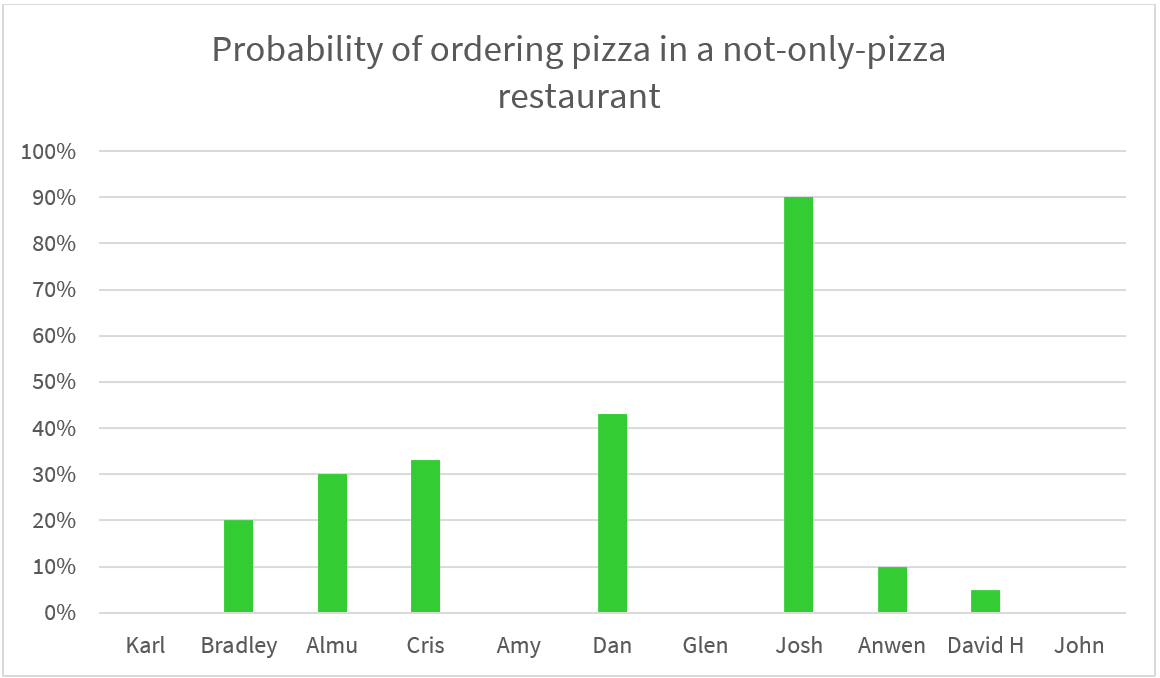
- If we were to go to a non-pizza restaurant, how likely are you to order pizza from their menu?
- On average how many days a week do you come to the office?
- What days do you normally come into the office?
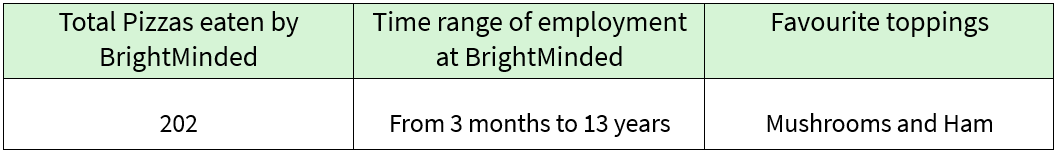
- What are your favourite pizza toppings?
- How do you feel about pineapple on pizza?
By asking these questions, we gained a clearer understanding of the data needed to begin calculating the results. The question about how long each person has worked at the company is especially crucial, as it helps us determine the number of years to consider for each team member, which will vary.
However, these questions aren’t the only factors we took into consideration. There were additional elements that we needed to keep in mind, which we had to estimate ourselves.
The other factors we estimated include:
- How many team lunches have there been since the company was founded?
- How many team lunches on average do we have each month?
- How many team lunches on average do we have each year?
- How many people attend each team lunch?
- What day of the week do we have the most team lunches?
- What day of the week do we have the most team members in the office?
It is important to consider every piece of information that could impact the calculation, beyond the initial questions posed to each team member. While this calculation is ultimately an estimate and won’t be perfectly accurate, incorporating all relevant factors allows us to get as close to accuracy as possible. Additionally, without these considerations, the calculation would be incomplete, as not all team members are always in the office. We can’t assume that everyone attends every lunch.
Therefore, we were able to estimate not only the total number of pizzas consumed by the team but also how much pizza each member likely ate, helping us determine who probably eats the most pizza at work.
The results of our calculations are:
Breaking down the calculation
To reach this calculation, we analysed the answers provided by the BrightMinded team in response to our questions and derived percentages based on these answers.
The primary factors we considered were the specific days each team member was likely to be in the office and the likelihood of the team choosing to eat at a pizza restaurant on those days. After determining how often team members dined at pizza restaurants and the frequency of team lunches, we concluded that there was one team lunch per month, with 25% of those taking place at pizza restaurants. From this, we estimated that the team would likely eat at 3 pizza restaurants over the course of a year.
Using this estimate, we calculated how many times each team member had visited a pizza restaurant during team lunches. For example, a team member who has worked at BrightMinded for 10 years would likely have eaten at 30 pizza restaurants over that time.
However, our calculations did not stop there. We also needed to determine which days team members were present in the office and the likelihood of ordering pizza at restaurants offering other menu options. We found that most team lunches occurred on Thursdays or Fridays, so if a team member wasn’t present on those days, it was unlikely they had attended a team lunch.
This analysis revealed that some team members attended the office daily, some only on Thursdays, while others worked entirely from home. Additionally, others only attended the office a certain percentage of the year, not every week, which had to be factored into our calculations.
Based on all these considerations, we developed a set of rules:
- If a team member came into the office every day, we calculated the number of pizzas they ate per year based on their tenure at the company.
- If they only attended on Thursdays, we halved the number of pizzas, assuming a 50% chance of them attending a team lunch (as team lunches were assumed to occur on either Thursday or Friday).
- If a team member occasionally ordered pizza at a restaurant with diverse menu options, we calculated the number of such restaurant visits per year, multiplied by the number of years they had been with the company, and then applied their pizza-ordering percentage to adjust the total.
- For those who came into the office only four times a year, we calculated 25% of their total pizza consumption.
- If someone came into the office every other week, we halved their total pizza consumption.
By applying these rules, we could add up the results to determine the total amount of pizza consumed during team lunches.
What are these types of questions? They are known as “Fermi problems,” which involve making estimates using mathematical reasoning to answer a query. Such problems don’t have exact answers and are often resolved with an approximate answer. Different approaches and factors can lead to alternative solutions, making them, as shown above, estimations—for example, estimating which days team lunches would likely occur.

Other examples of Fermi problems
These types of problems do not stop with just one question; there are countless examples you can explore to get yourself thinking and dive into fun, interesting scenarios that you might not normally consider. If you’re looking to gain a better understanding of your team, as we did with our pizza question, you can even create your own unique problems.
Some other examples of fermi problems are:
- Assuming one Santa Claus visits all christian children on Christmas, how fast would he have to travel?
- How many people pass through Gatwick Airport every day?
- How many golf balls does it take to fill a suitcase?
- How many individual hairs do you have on your head?
- How many dump truck loads would it take to cart away Mt. Everest?
Obviously, you can develop more professional questions tailored to your company’s needs, but why not tackle something intriguing? Since the statistics aren’t exact, they don’t need to serve a strictly professional purpose.
However another question that may arise from these problems, is can you do these calculations with any statistic and any question?
Technically, you can create estimates for any question framed along the lines of: “how many,” “how fast,” or “how long”, but it’s important to ensure you can access the necessary information and considerations to determine if a meaningful result can be achieved.
If you’re working with questions involving real people, you’ll need to decide what to ask them and assess whether it’s possible to gather this information rather than relying on assumptions. Additionally, you will need to determine if you can obtain general statistics for your question, whether through online research or other means. For instance, if you’re estimating the number of bricks in a city, you would start by looking up the number of buildings in that city and so on.
To show further how this works beyond our team’s pizza calculations, we can show what was needed to be found out for one of the example questions, and the results of that as well.
For this I will use a rough estimation of the question: How many people pass through Gatwick Airport every day?
To resolve this question, we researched various sources, including Google and the Gatwick Airport website, to gather estimated data that would help us calculate our answer. In cases where online information was unavailable, we made rough estimates ourselves, such as estimating the general number of staff working at the airport.
Some of the questions we searched up estimations for were:
- How many people make up an average flight crew?
- How many planes depart from and arrive at Gatwick Airport daily?
- On average how many 8 hour work shifts would take place each day?
- How many shops and restaurants are there at Gatwick Airport?
- How many check-in desks are there at Gatwick Airport?
These aren’t the only questions we needed to answer for these results, but it can give a rough idea of the kinds of questions you need to be researching in order to discover the answers for your own Fermi problems.
From these types of questions, we estimated that there were an average of 5,594 staff, and 112,054 passengers passing through Gatwick Airport every day, bringing the total to 117,648.
For the number of passengers you can find this information on Gatwick Airports website, as they have provided the details of 40.9 million passengers travelling in 2023. However, we did our own calculations for people who were not passengers, which included staff such as flight crew, check-in staff members, security, and any other positions we could think of on top of this.
While these figures are based on estimations and not precise statistics, such as the exact number of passengers on each plane, this exercise demonstrates a fun and engaging way to approach calculations. The questions we explored can also serve as inspiration for creating your own Fermi problems and estimates.
How these questions stimulate thinking
These types of questions and calculations are not only fun but also intellectually stimulating.
Depending on the complexity of the question, finding the answer can be challenging and may require more detailed statistics.
For example, simpler questions like estimating the number of arrivals and departures at Gatwick Airport can be calculated using rough data. However, more complex questions—such as calculating how Santa Claus visits all the children on Christmas—require additional factors, like determining the number of Christian families worldwide and calculating the necessary timing and speed in miles per hour. So if you really want to get yourself thinking, then you can find questions that require more difficult equations.
However, these questions don’t just get you thinking, and create conversations based on calculations, you can also use these problems to spark debate amongst people.
We used two questions posed to our team: “What is your favourite pizza topping?” and “How do you feel about pineapple on pizza?”. While these questions didn’t directly contribute to our goal of estimating how much pizza our team consumes, they served another purpose.
They sparked lively debates and revealed the diverse opinions within our team. We received a variety of responses for favourite pizza toppings, including ham, mushrooms, and pepperoni. But the most anticipated question, of course, was about pineapple on pizza, a topic known for its divisiveness.
As expected, the answers varied widely: some people said, “It’s awesome, why not!” and “Favourite topping!” while others responded with, “Blasphemy!!” and “It’s a hate crime.” Interestingly, some team members expressed that they enjoy pineapple on pizza only when paired with other ingredients or if it’s the only option available and they are forced to eat it. Despite its controversial nature, our team’s responses were surprisingly balanced, showing a nearly equal split between those who like it and those who don’t.
 Information obtained from YouGov about UK adults thoughts on pineapple on pizza in 2024.
Conclusion
It’s evident that our team shares a love for pizza, and it’s heartening to reflect on how long we’ve all been at BrightMinded, growing together as a cohesive unit. The togetherness we’ve built is as satisfying as the pizza we enjoy.
We hope this article has inspired you to dive into creating your own Fermi estimates, whether just for fun or to discover more about your team. We’ve shown how you can blend both fun and team representation in this exercise. By now, you should also have a clearer understanding of the types of questions to ask and how to find the numbers you need to complete your calculations. And if you feel like it, share with us your own pizza habits and let us know your favourite toppings too!