WWF dynamic environmental impact infographics
WordPress site using real-time environmental data to drive behaviour change at the WWF-UK HQ

Location: Woking, UK
Display data as dynamic animated infographics
Engage staff and visitors to drive behaviour change

The World Wide Fund for Nature UK have recently moved into the Living Planet Centre – a custom-designed new building in Woking which is a fantastic example of sustainable design and construction.
The site is chock-full of energy efficient environmental measures including ground-source heating, water harvesting and recycling, and wind cowls for natural ventilation. Monitoring stations around the building provide real-time data about energy and water use, and WWF-UK contracted BrightMinded to realise visualisations of this data for staff and visitors on screens inside the LPC.
Driving behaviour change through design
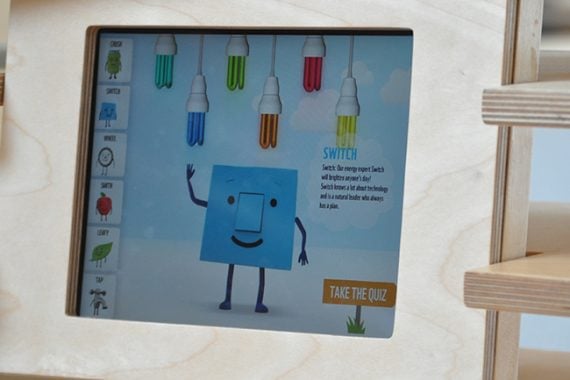
With our design partners at Neo we developed the idea of Living Planet Centre Live. This is a platform which combines real-time data from the Building Management System with data entered manually by the WWF-UK team, and generates data visualisations using a variety of techniques.
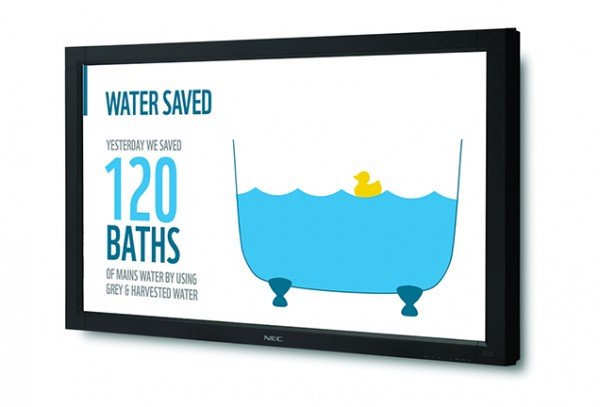
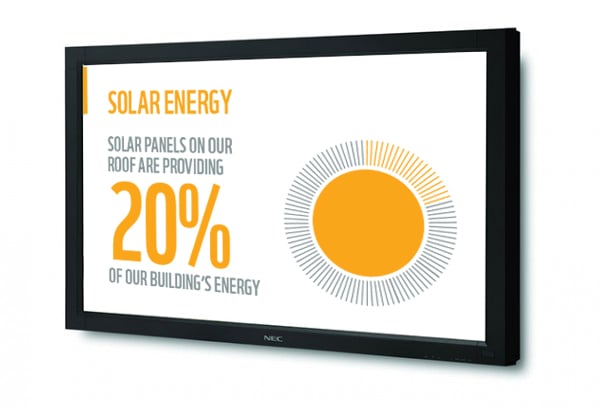
As well as our duck bobbing up and down to indicate water savings in terms of number of baths, we have the sun’s rays indicating solar energy generation, kettles indicating electricity savings, and a variety of of other charts and visualisations which really bring the data to life.
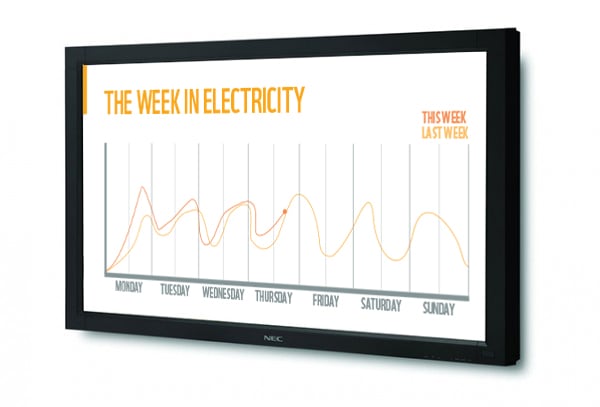
The animations help to tell the story of the building to visitors in the reception area, and help to drive behaviour change among the staff, who can see the effect of their energy-saving decisions.
Data interrogation
The Living Planet Centre has a Trend Building Management System installed, with monitoring outstations providing data from each part of the building. This data includes electricity use, PV solar energy generation, mains water use, and volume of harvested and recycled water.
We used a RESTful API to interrogate the Trend outstations every 15 minutes, parsing the returned XML into the format we needed for the various visualisations. Further calculations were needed to generate the averages and running totals required for some of the charts and animations.
Why WordPress?
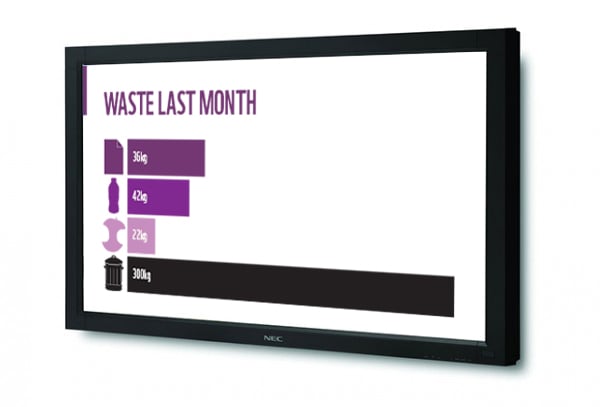
As well as the automated data, the WWF-UK team needed to enter data manually about the amount of waste they were generating, and also keep track of biodiversity figures by entering sightings of mammals, birds, insects and plant species.
This requirement for a CMS made WordPress the natural choice for the platform, and its flexible extensibility meant we were able to add plugins on top to integrate with the Building Management System. We store the large amount of BMS data in custom tables within the WordPress database, and transform it as required for the visualisations.
The visualisations are only visible within the Living Planet Centre itself, but they are receiving great feedback from staff and visitors. If you’re in Woking pop along and have a look for yourself!
OTHER CLIENTS WE’VE HELPED
We’ve built over 100 custom-made platforms and websites for charities, start-ups and established businesses since 2011.
